The Social Network Visualizer project has released a brand new version of the Social Network Analysis application which brings major code overhaul, new GUI layout, significant improvements and lots of bugfixes.
SocNetV v2.0 brings stability, great performance boost and nice new features for easier social network analysis such as separate modes for graphs and digraphs, permanent settings/preferences functionality, edge labeling, recent files, keyboard shortcuts, etc. Also there are improvements in Force-Directed layouts, i.e. Fructherman-Reingold. See below a walk-through of the new features.
Major code overhaul for memory and performance optimization.
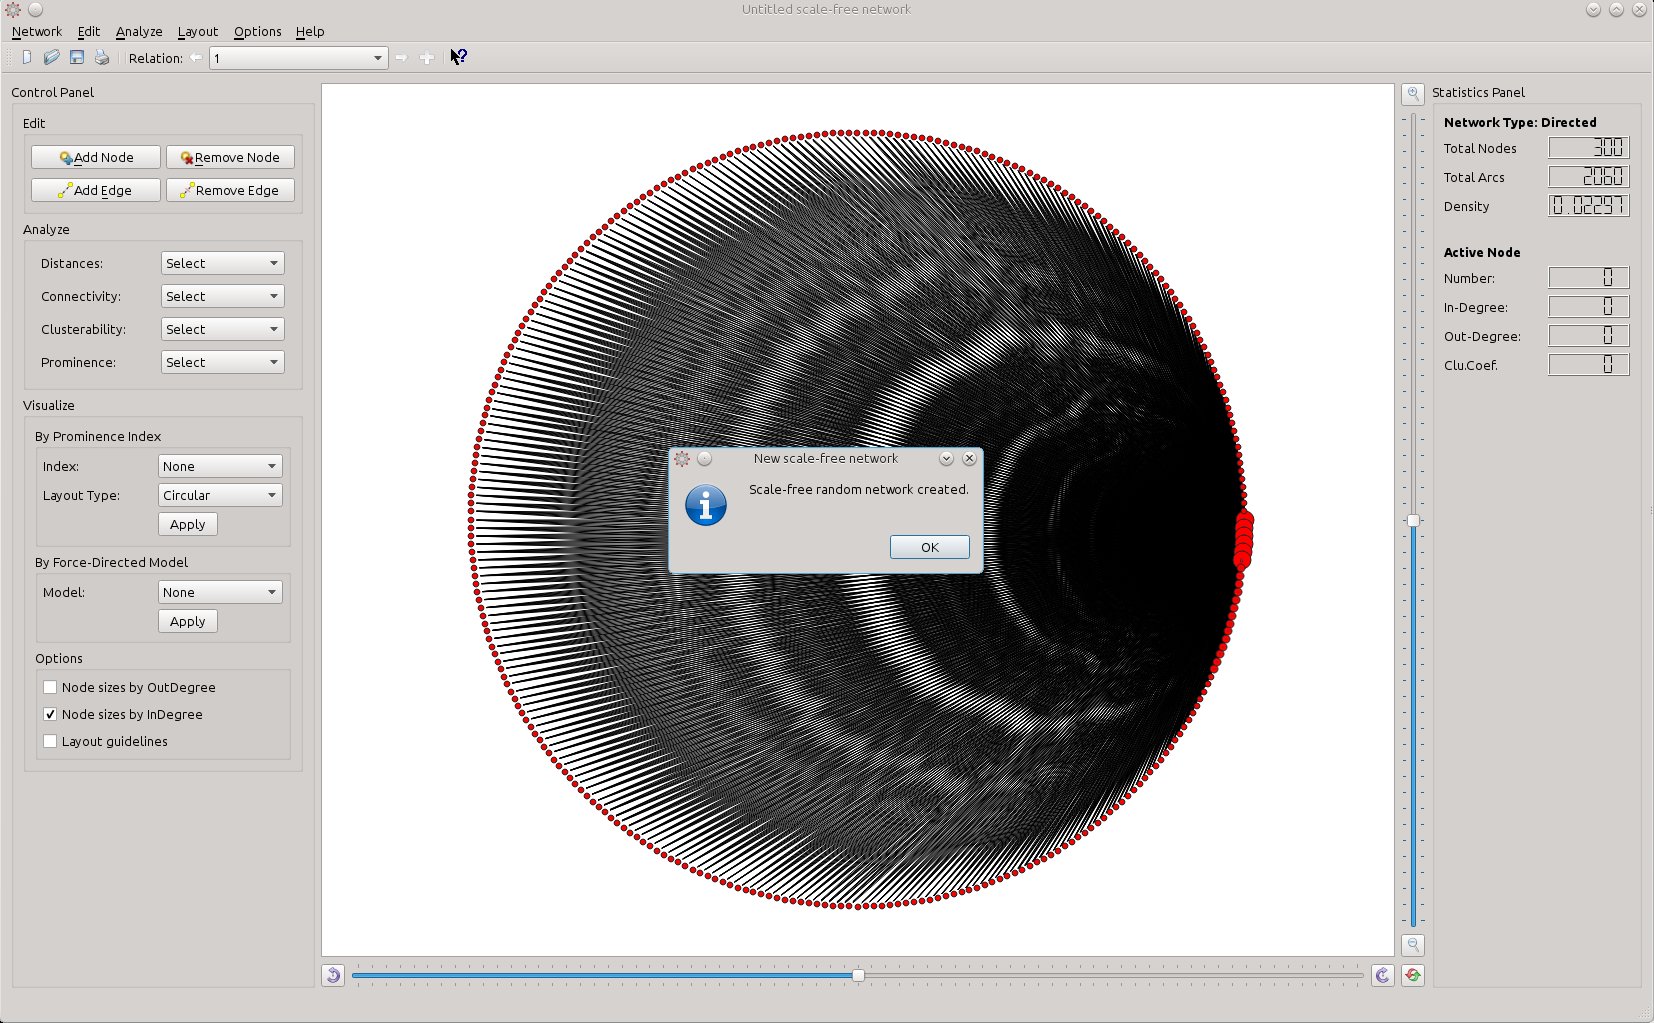
SocNetV 2.0 occupies less memory and executes most social network analysis and visualization operations much faster than before. For instance, random network creation is faster and more reliable as many bugs have been fixed. Also, network/graph data loading from various formats has also been optimized for speed and efficiency.
New GUI layout
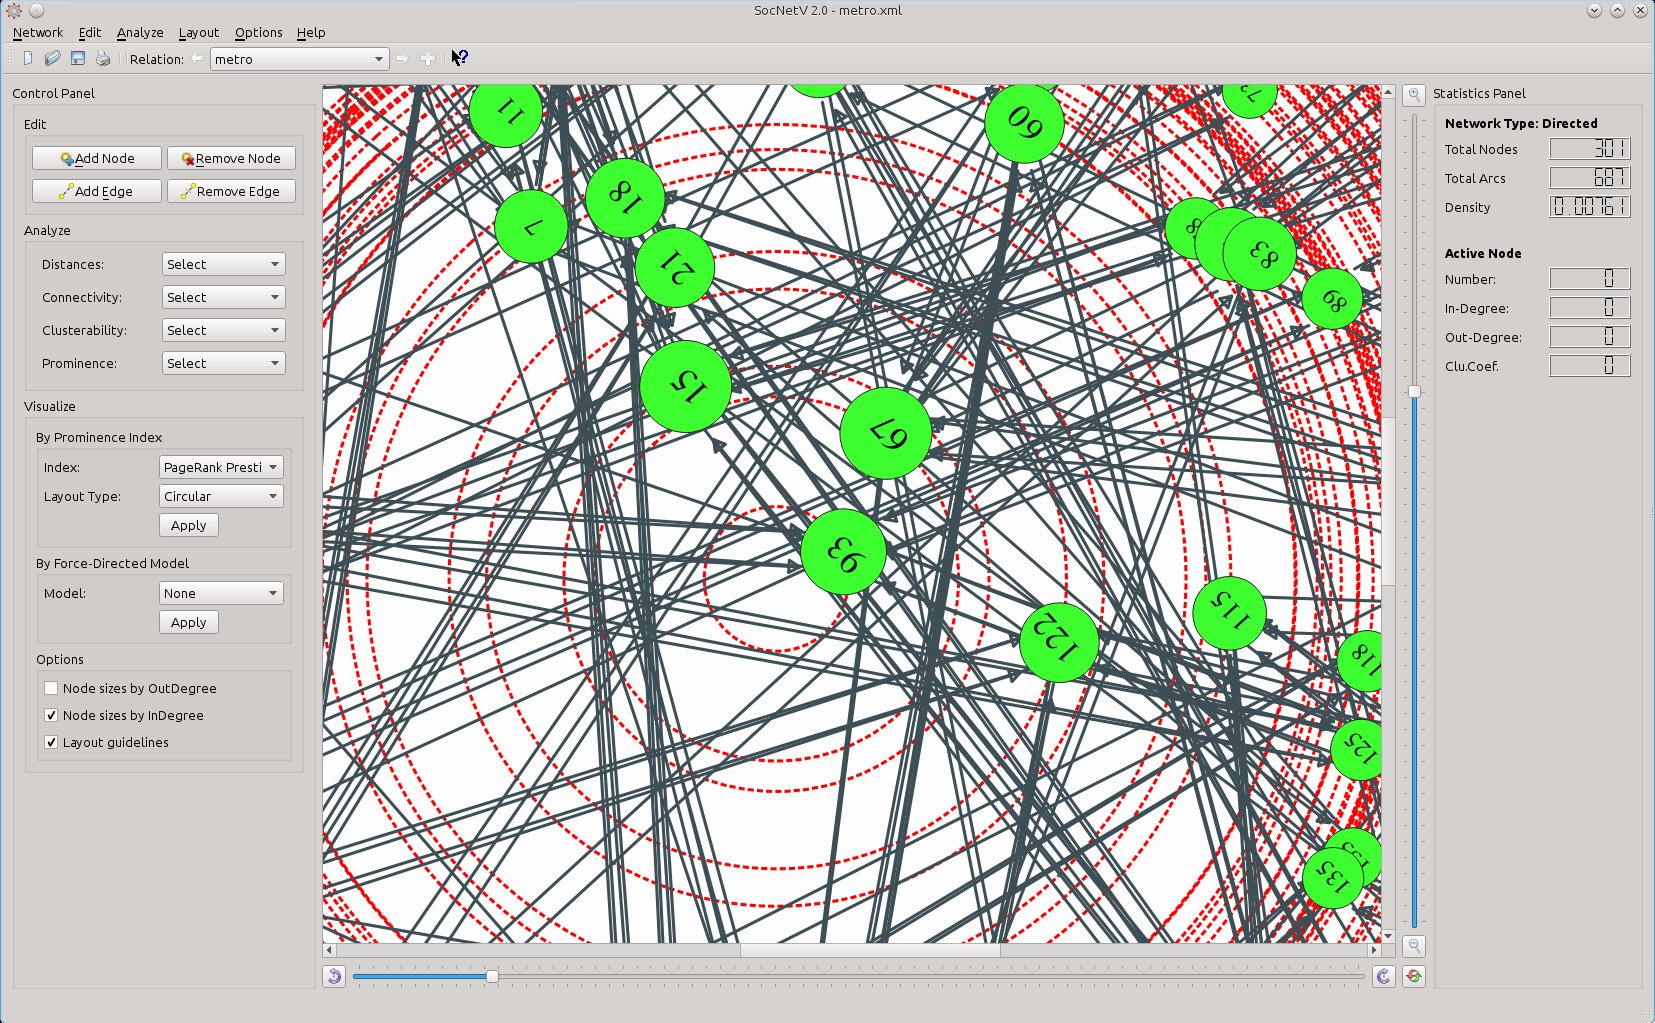
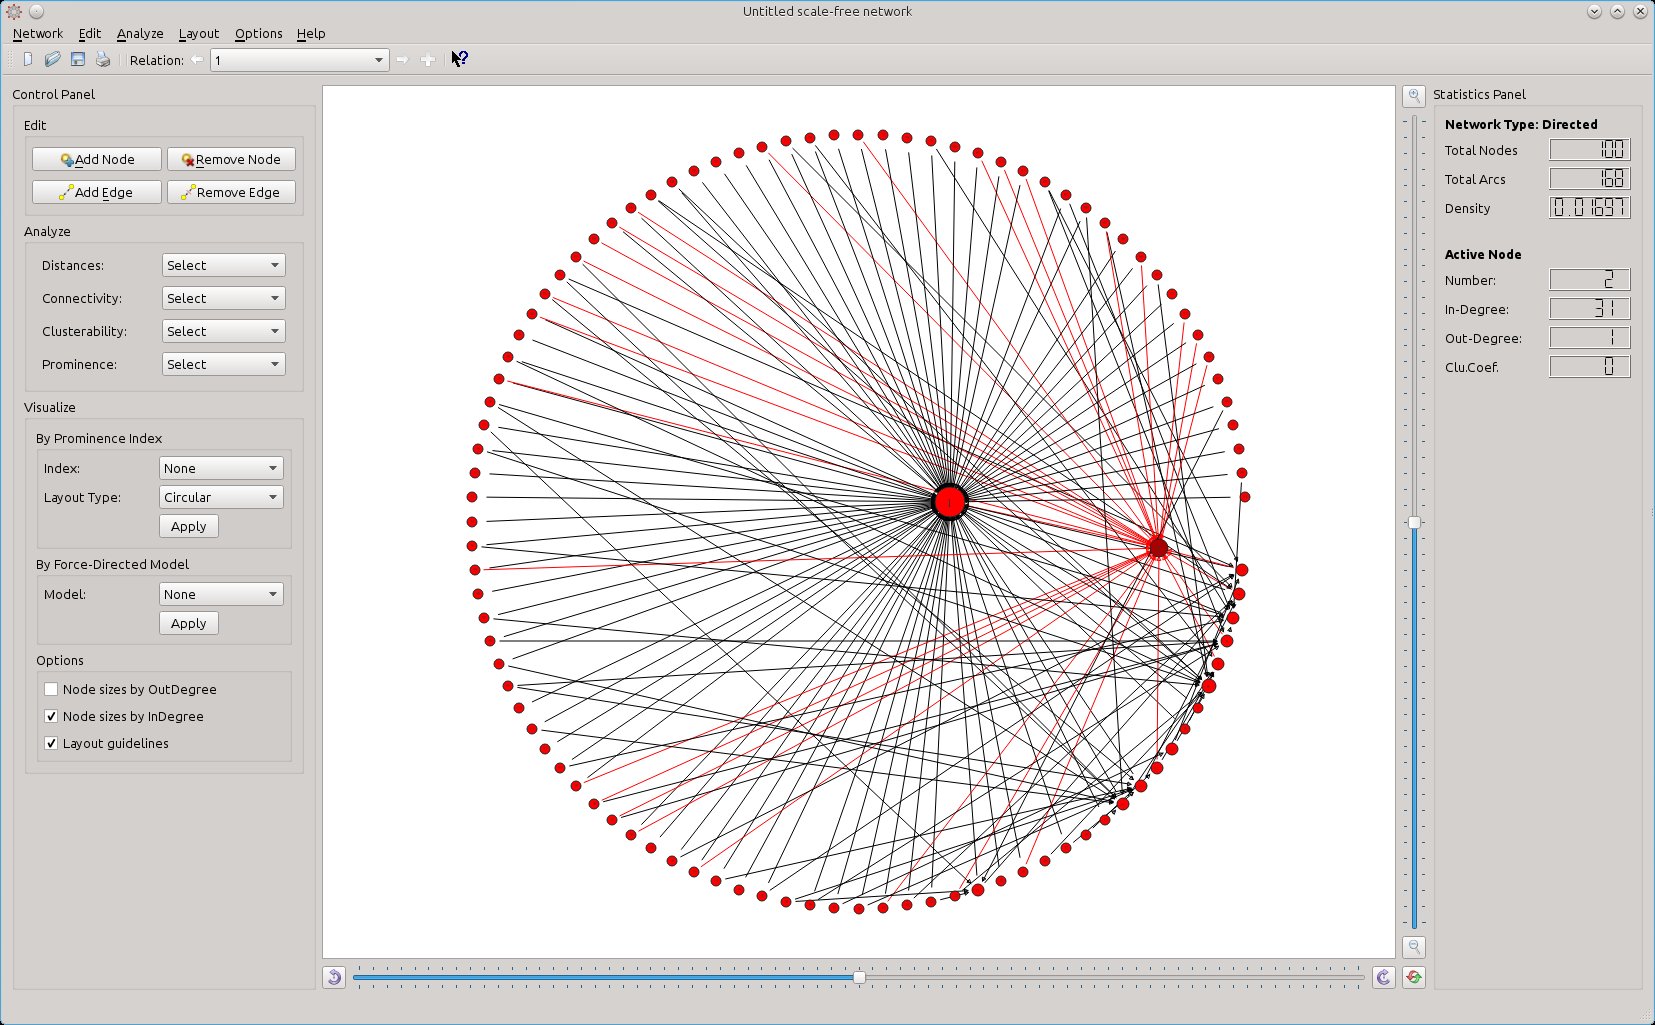
The new SocNetV Graphical User Interface is, we hope, much easier and intuitive. There are no more tabs on the left side of the application window. Instead, the new GUI offers two side panels along the main canvas. The left panel (called Control Panel) offers graph editing buttons and network analysis/visualization options to be selected with one click. The right panel (called Statistics Panel) shows basic information and statistics about the whole social network and the last clicked node, such as network type (undirected or not), network density, node in-Degree and out-Degree and node Clustering Coefficient.
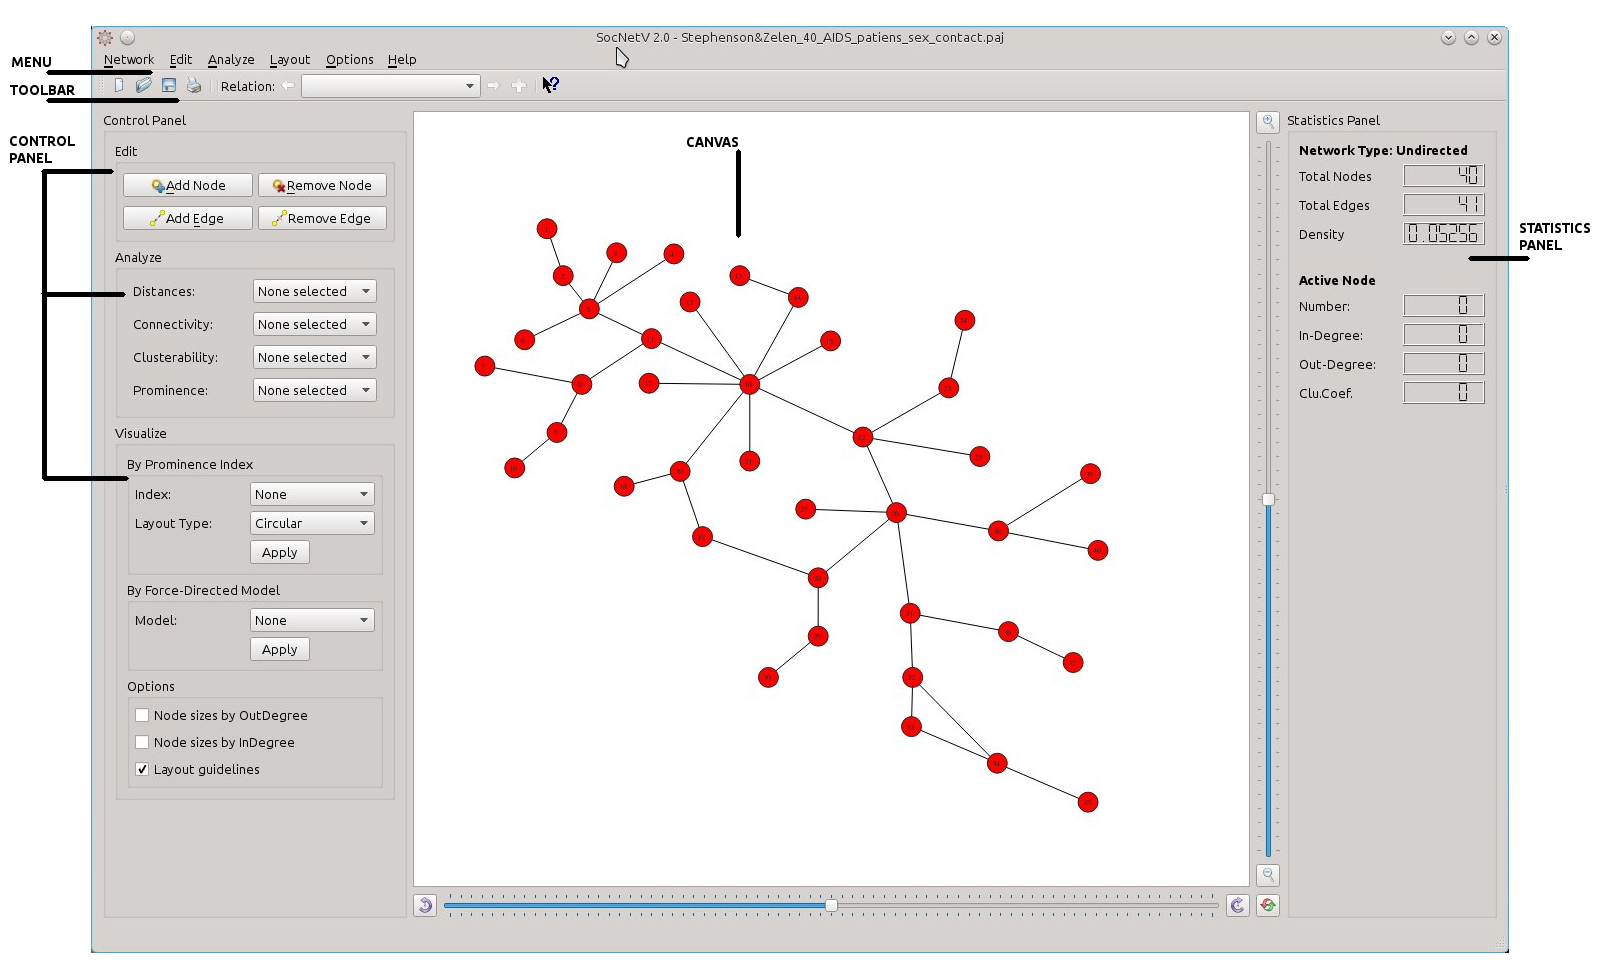
Note: If you need more canvas space for your social network visualization, you can show/hide the panels from the Settings & Preferences dialog (see below).
You can create new nodes with the usual ways (double-click on empty space or click on the button Add Node) and draw edges between them. To draw a new edge between two nodes, double-click on the first and then double-click on the second. Or just right-click on the first node and select Add Edge (and enter target node number).
Node Numbers inside
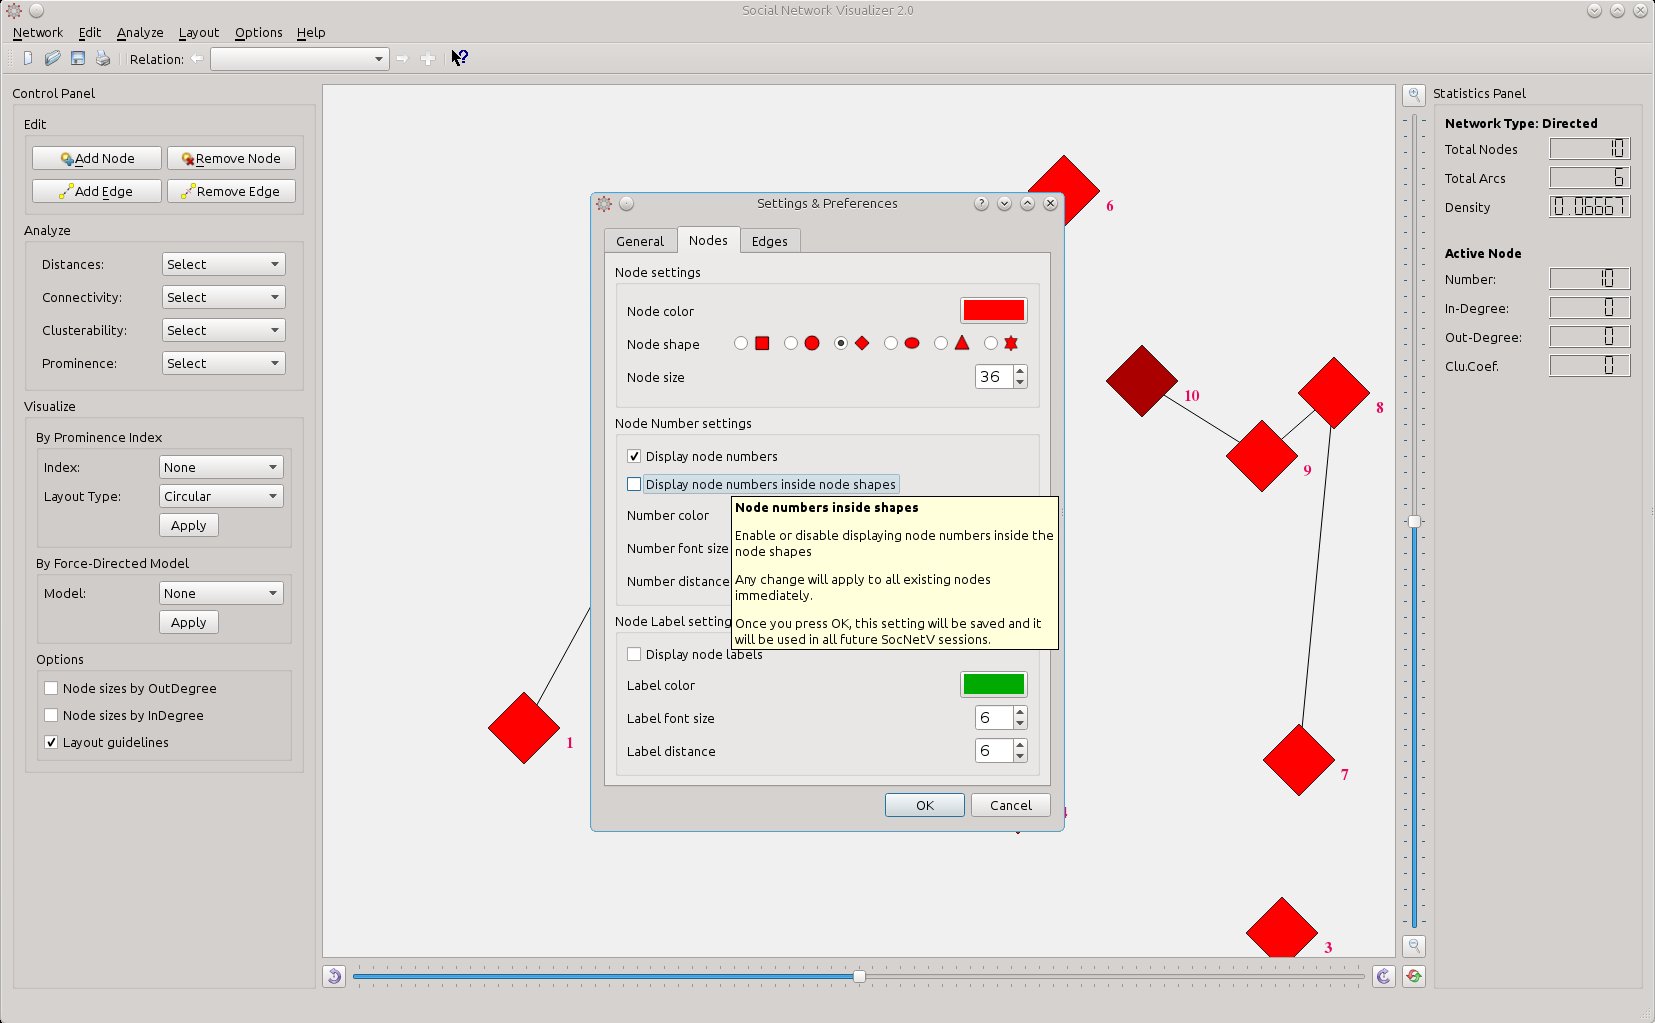
As you see in the screenshots, the default behavior for nodes is now to draw their numbers inside the node shape.
We think this helps minimize clutter but you can always have node numbers out of nodes. Go to menu Options -> Nodes and disable "Node Numbers Inside Nodes".
To permanently change this settings, use the option in the Settings & Preferences dialog (new feature - see below).
Zoom and Rotation Sliders
Furthermore, along the canvas there are two new sliders. The bottom horizontal slider controls canvas rotation. Drag the slider left-right or use the buttons on the two corners to rotate the whole network counterclockwise or clockwise.
The vertical slider on the right side of the canvas controls zoom. Drag the slider up-down or use the buttons on the two corners to zoom in or out. There is also a nice "reset zoom and rotation" button on the bottom right corner.
Keyboard shortcuts
To facilitate analysis work, most functions and operations have been given a nice shortcut. If you prefer using the keyboard to create and analyze your social networks, the new version brings you everything to your fingertips. For instance, press CTRL+. to add a new node and CTRL+/ to add a new edge. Here is a brief cheatsheet with shortcuts:
- Add new node: Ctrl+.
- Add new edge: Ctrl+/
- View network file: F5
- View adjacency: F6
- Recreate datasets: F7
- Create random network: Ctrl+R+key (where key=E for Erdos, S for Scale-Free, W for Small-World, etc)
- Web crawl a site: Shift+C
- New relation: Ctrl+Alt+N
- Next relation: Alt+right arrow
- Previous relation: Alt+left arrow
- Zoom In: Ctrl+Shift++
- Zoom Out: Ctrl+Shift+-
- Rotate counterclockwise: Ctrl+left arrow
- Rotate clockwise: Ctrl+right arrow
- Symmetrize Edges: Cltr+E+S
- Undirected Edges/Mode: Ctrl+E+U
Tooltips and help
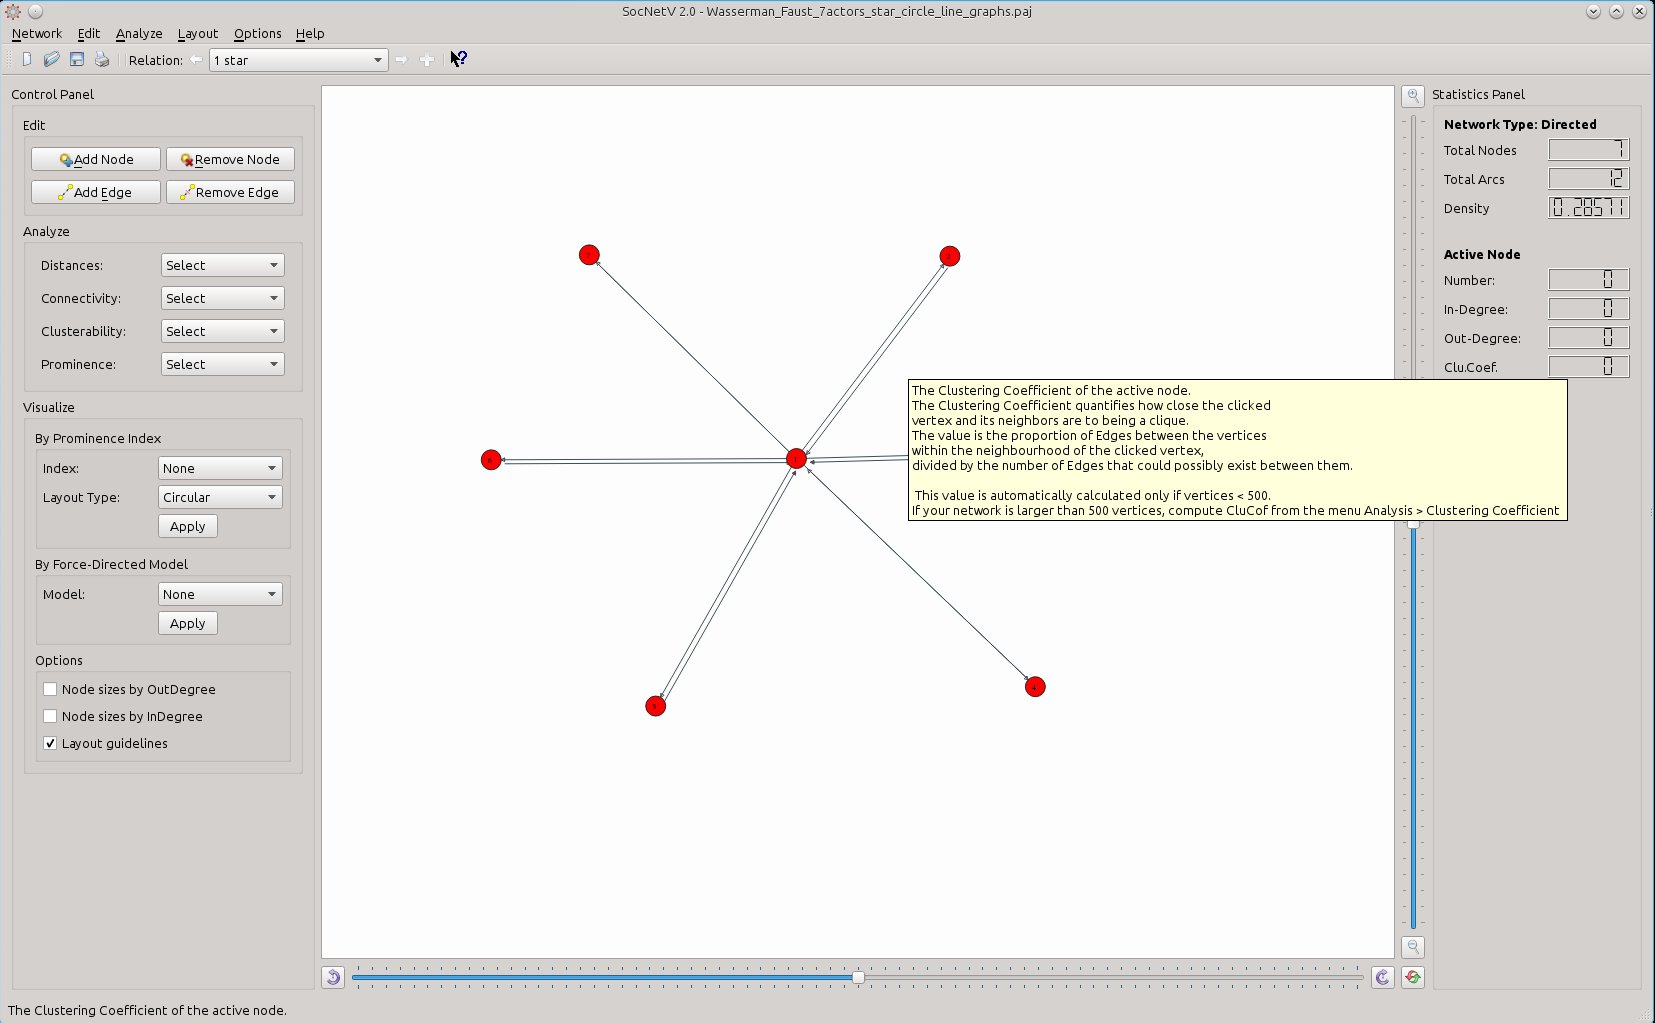
What is a nice GUI if it does not help even the novice user to start using the application? With that in mind, tooltips and “What's This” help messages have been added to most GUI elements. Just hover on any button or control widget and a helpful tooltip will appear to explain what it does. You can also click on the “?” button on the toolbar and then click on any menu entry, button, checkbox or widget to see a relevant explanation.
New feature: Settings & Preferences dialog and permanent settings functionality
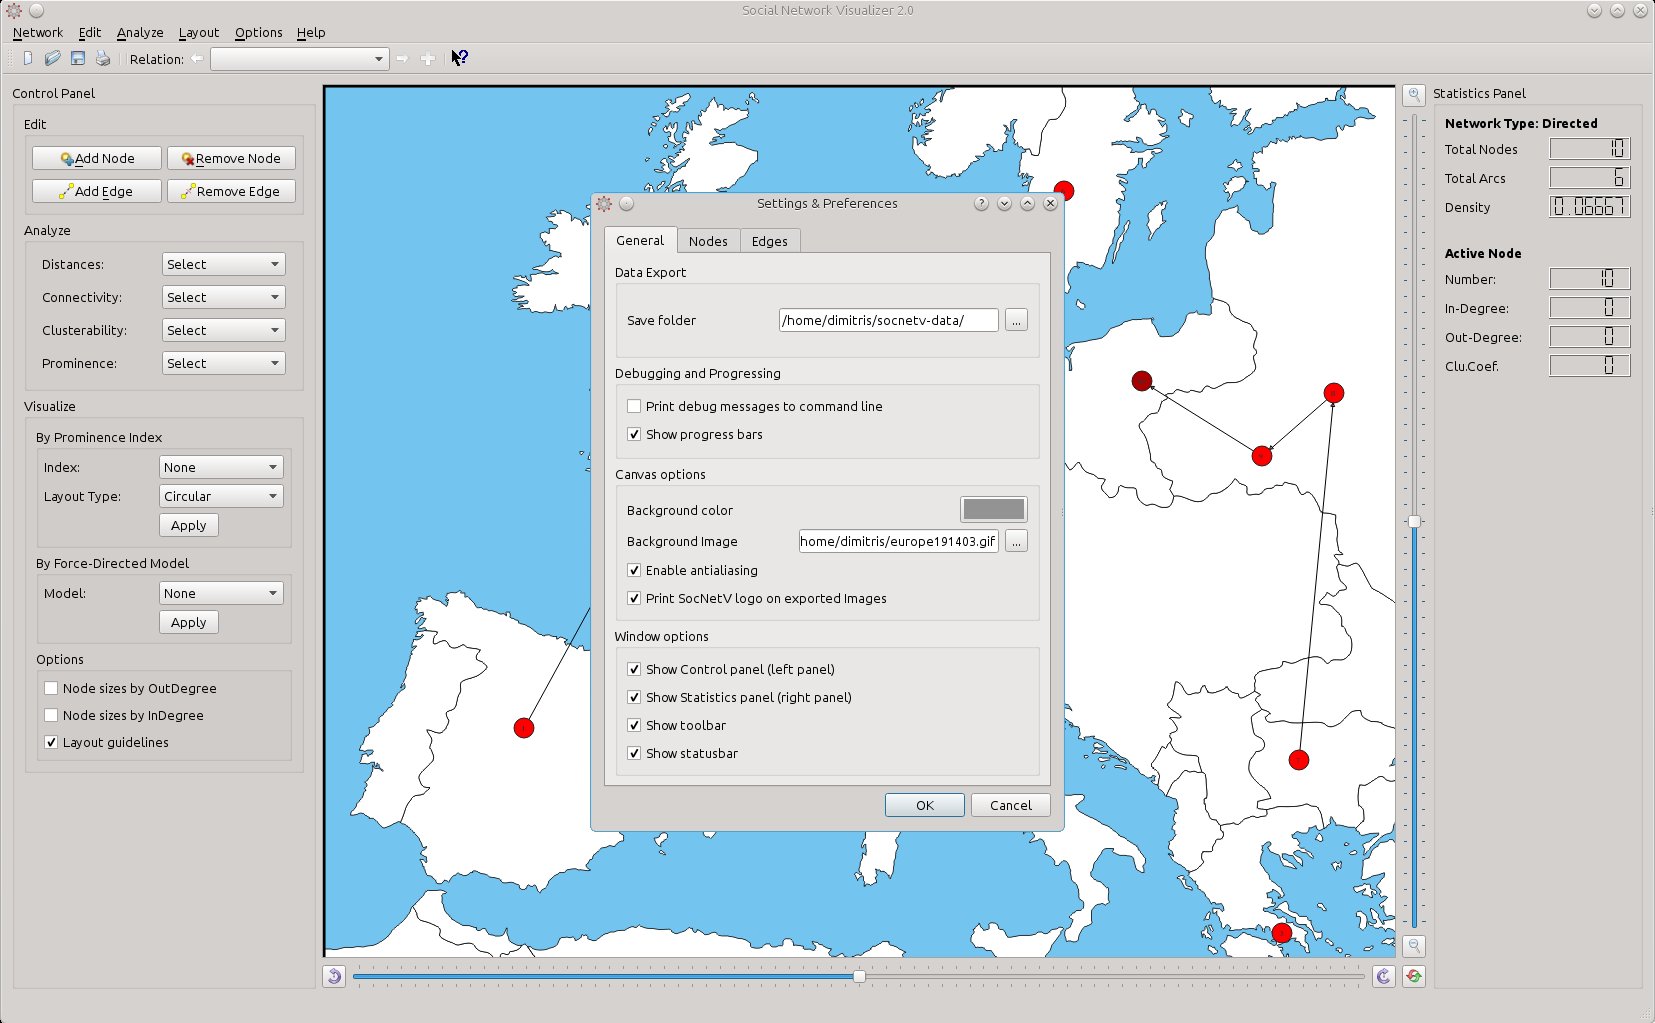
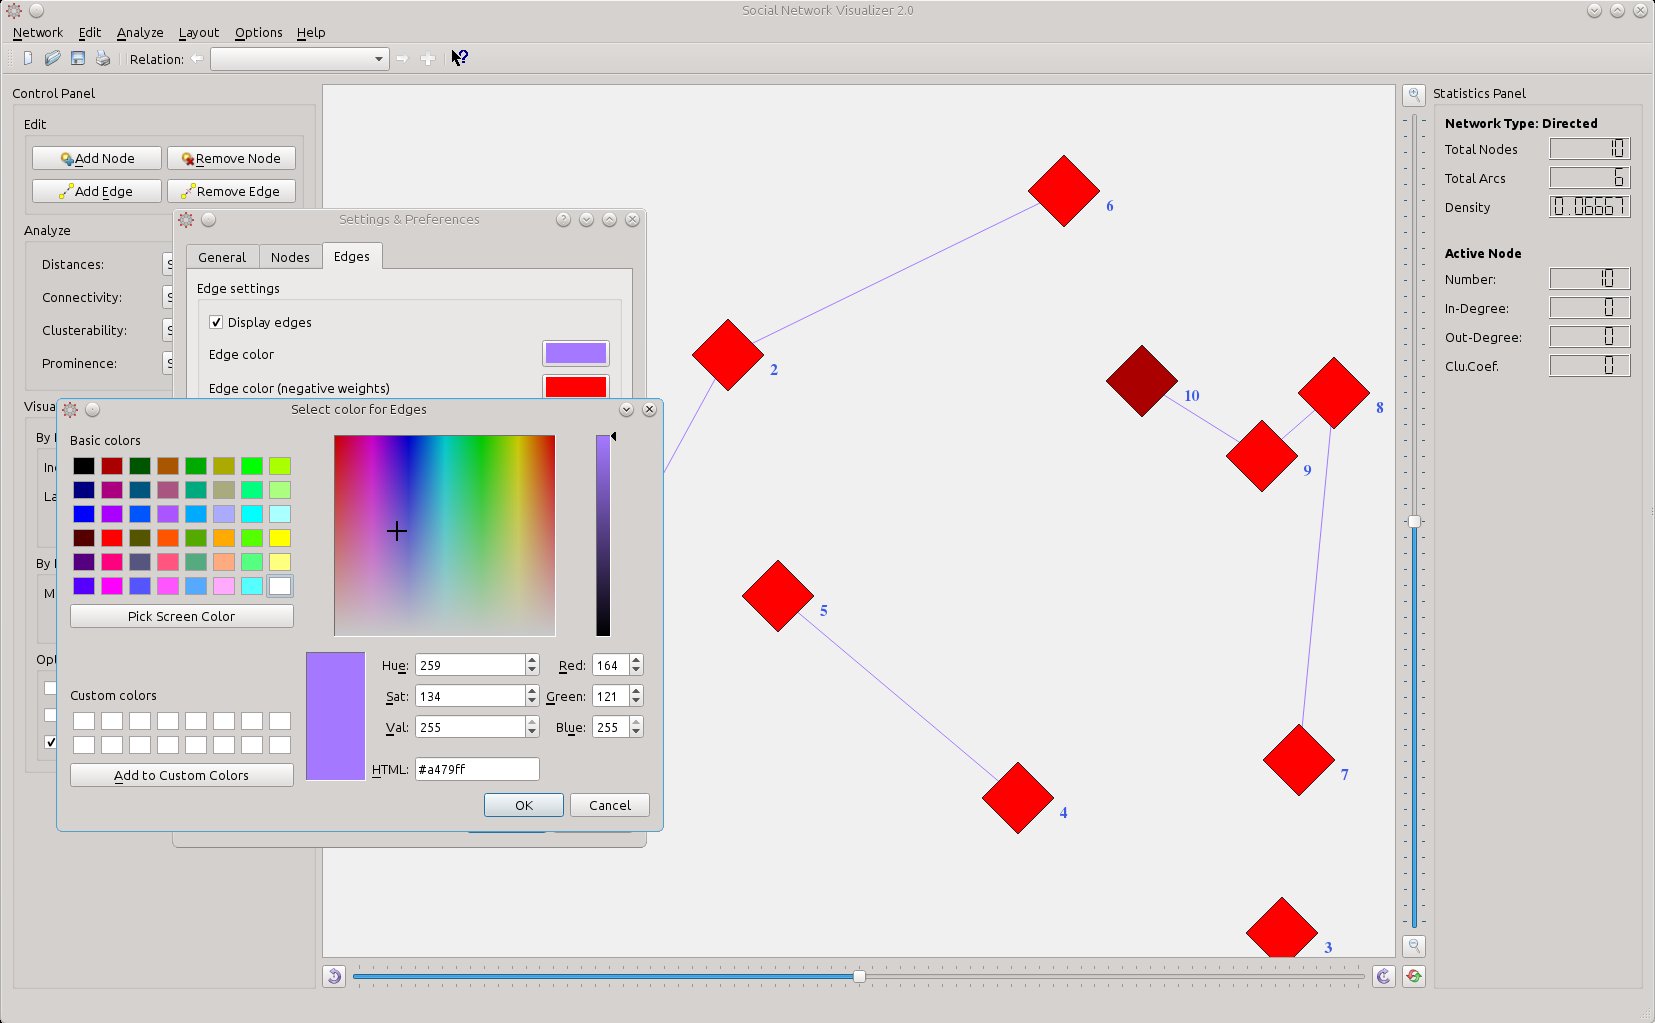
In the past, SocNetV did not offer any way to permanently save some of your preferences, i.e. node and edge colors. Version 2.0 brings that functionality in the form of a powerful and user-friendly Settings dialog. You can find it under Options menu in Windows/Linux and Application menu in Mac). It can also be invoked using the keyboard shortcut CTRL+comma.
The dialog is composed of three tabs: General, Nodes, and Edges. In the General tab, users can change and permanently save their options such as debugging messages printing, progress bars appearance, canvas color and background etc. From this tab, you can also hide the two panels, so you can use the whole application window as canvas for social network analysis and visualization.
The Nodes tab has settings about the nodes (default color, size, shape), node numbers and node labels (toggling, color, font size and distance from the node).
Similarly, the Edges tab offers permanent settings about the edges, their color, weight displaying/size and labels (yes, this is a new feature: edge labels, see more below).
Any change to the options in the Settings dialog is applied at once. When the user presses the OK button, all settings are saved in a settings.conf file in the home directory and they will be used by default in all future sessions.
Note that some of these settings are also available as single options in the Edit and Options menus. But any change to these options from the menus will be temporary and will be lost once you close the application.
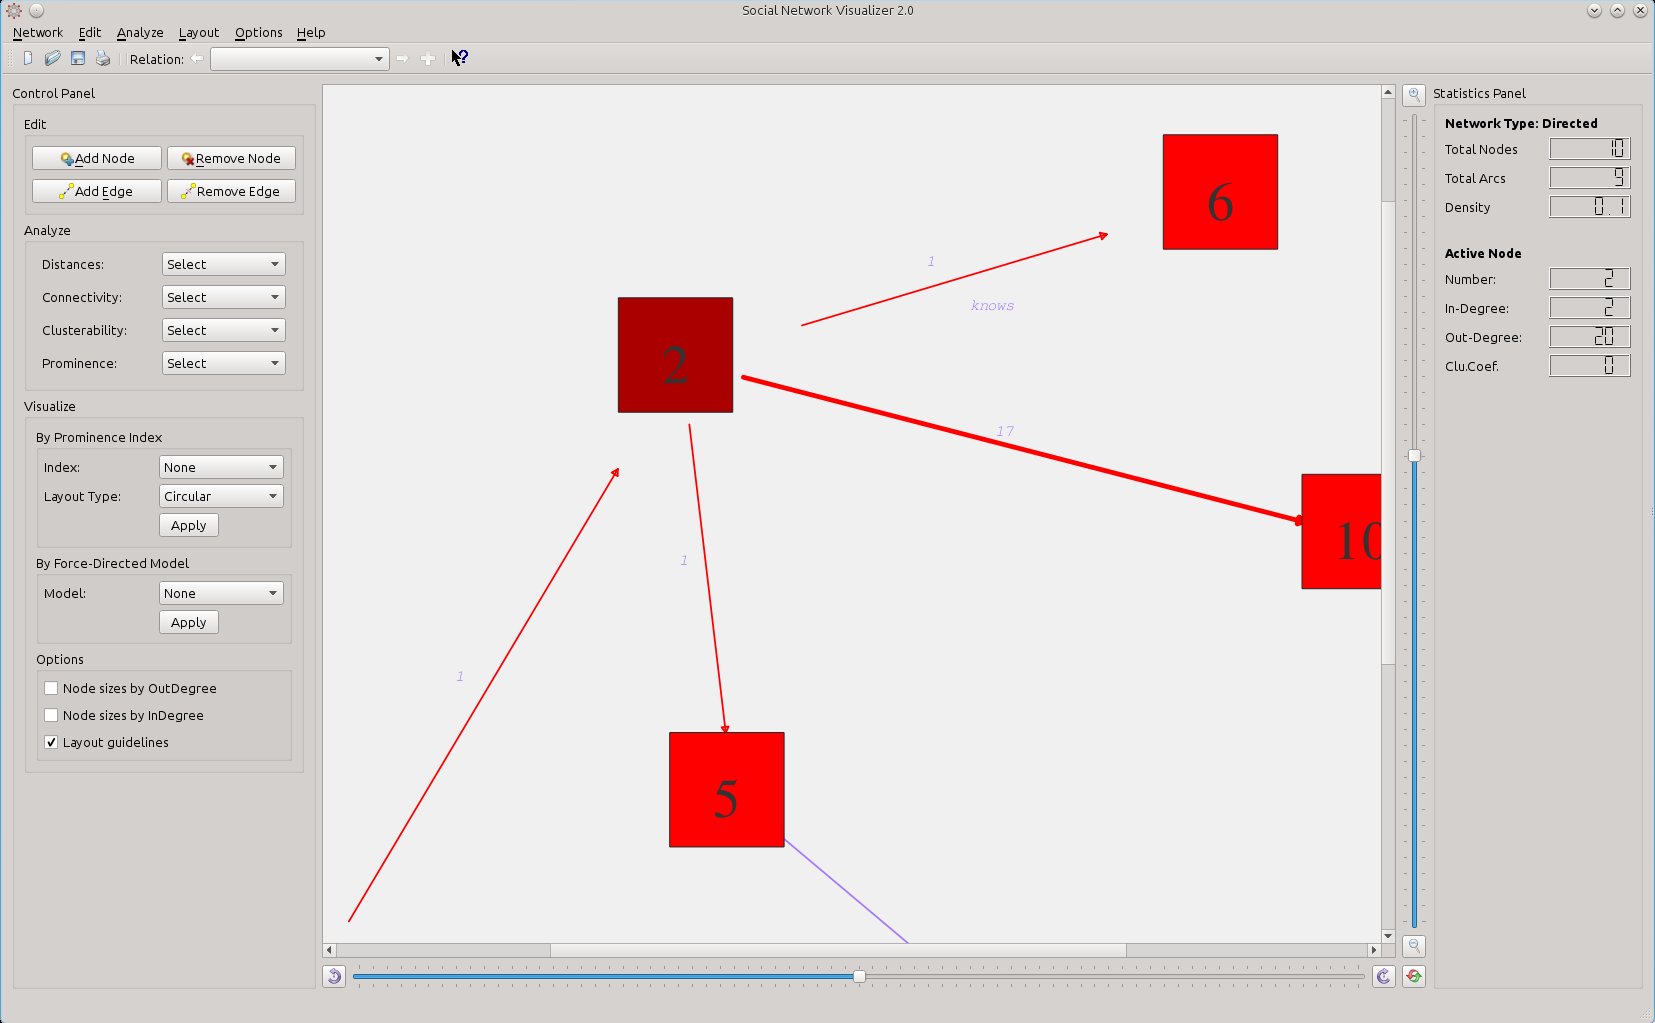
New feature: Labels on edges.
As mentioned above, edges can now have labels arbitrary chosen by the user, which are displayed along with their weights. Just right-click on an edge, select "Change edge label" and enter a new edge label. The edge label visibility can be toggled temporarily from the Options -> Edges menu or permanently from the Settings dialog.
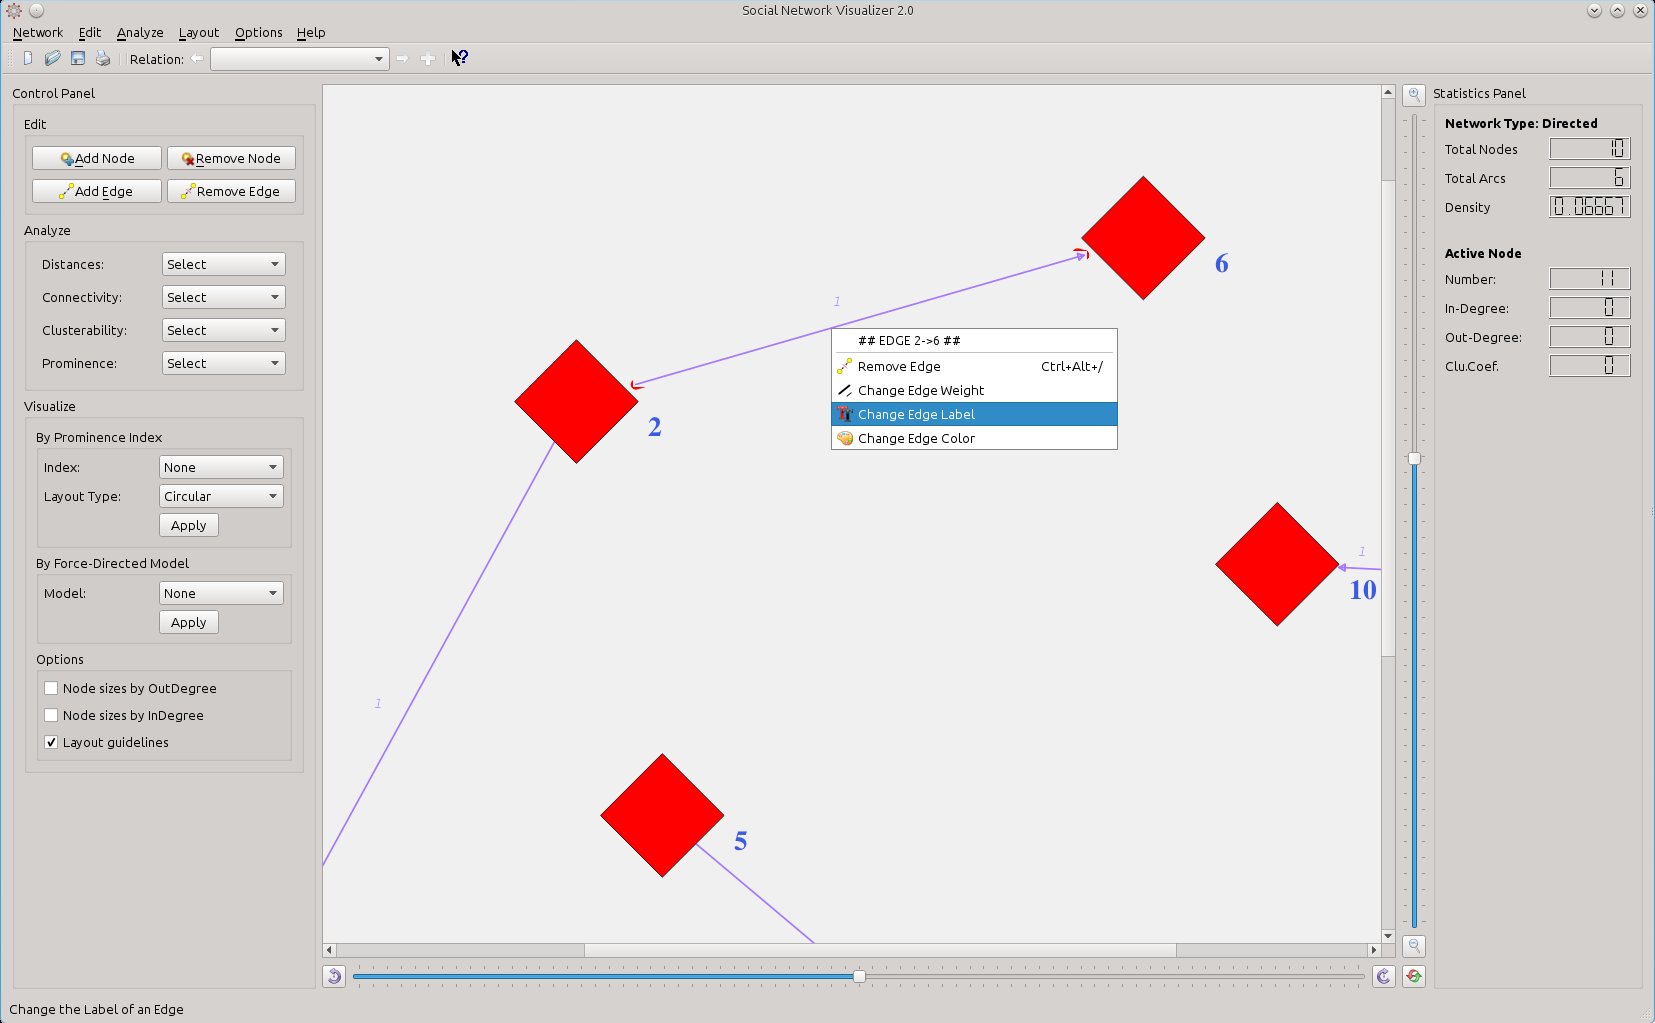
Here is a network with edge labels:
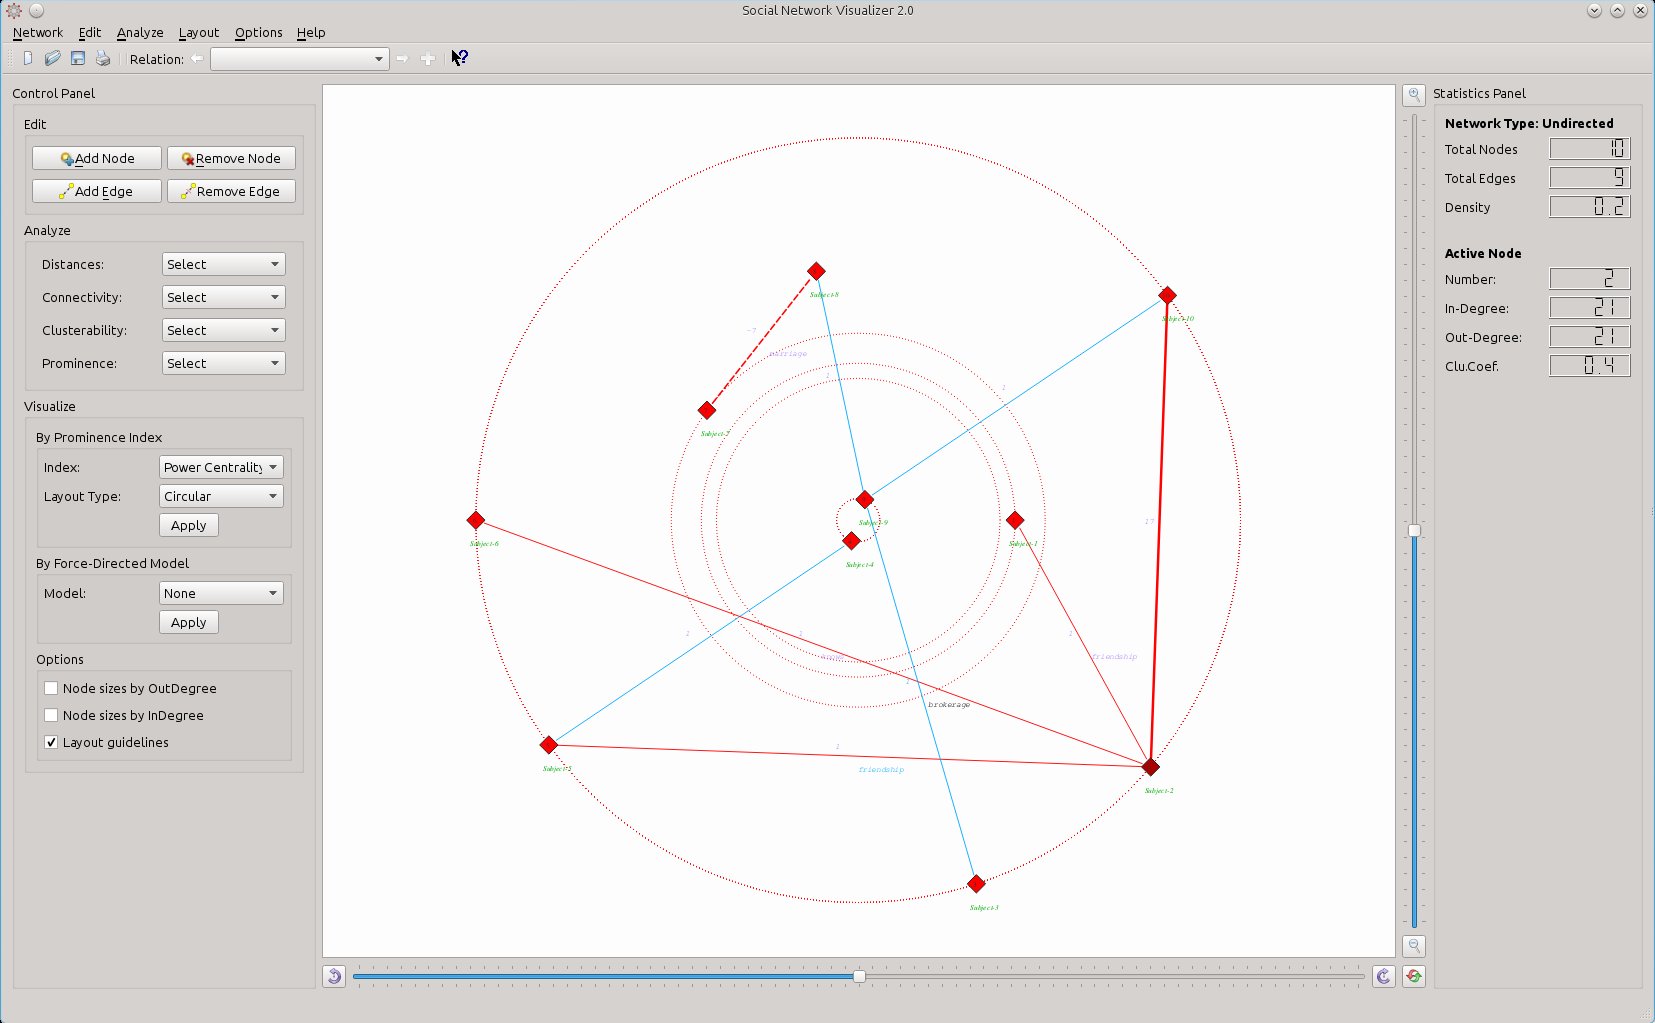
Note: At the moment, edge labels are saved only in GraphML formatted files.
New feature: Directed Edges on different lines
The new version brings a long requested functionality: the ability to depict directed edges between two vertices with different lines. In past versions, edges (directed and undirected) between two nodes were displayed as a single line. Only small arrows on the two corners of the line were indicating if that edge was inbound, outbound or both (reciprocal or undirected). That did not help the user to see at once if the two nodes were connected by one undirected edge, one directed edge or two reciprocal directed edges between them.
This problem is solved in the new SocNetV v2.0. All directed edges are displayed as separate lines on the canvas. Thus, if you add a tie from node A to node B and another tie from node B to node A, you will see two different directed lines: one from node A to B and another from node B to node A. The same is true if you load a directed social network.
New feature: “Directed” and “Undirected” mode
By default, SocNetV 2.0 uses a “directed mode” when creating new edges between nodes. Namely, any new edge you create by point-and-click (or using Ctrl+/) is considered to be a directed one.
But there is also an “undirected mode”, when you want to create or edit undirected social networks, or convert a directed network to undirected one. To enter this mode, enable the menu option Edit -> Edges -> Undirected edges. Note: You can see the actual edge mode at the top of the Statistics Panel.
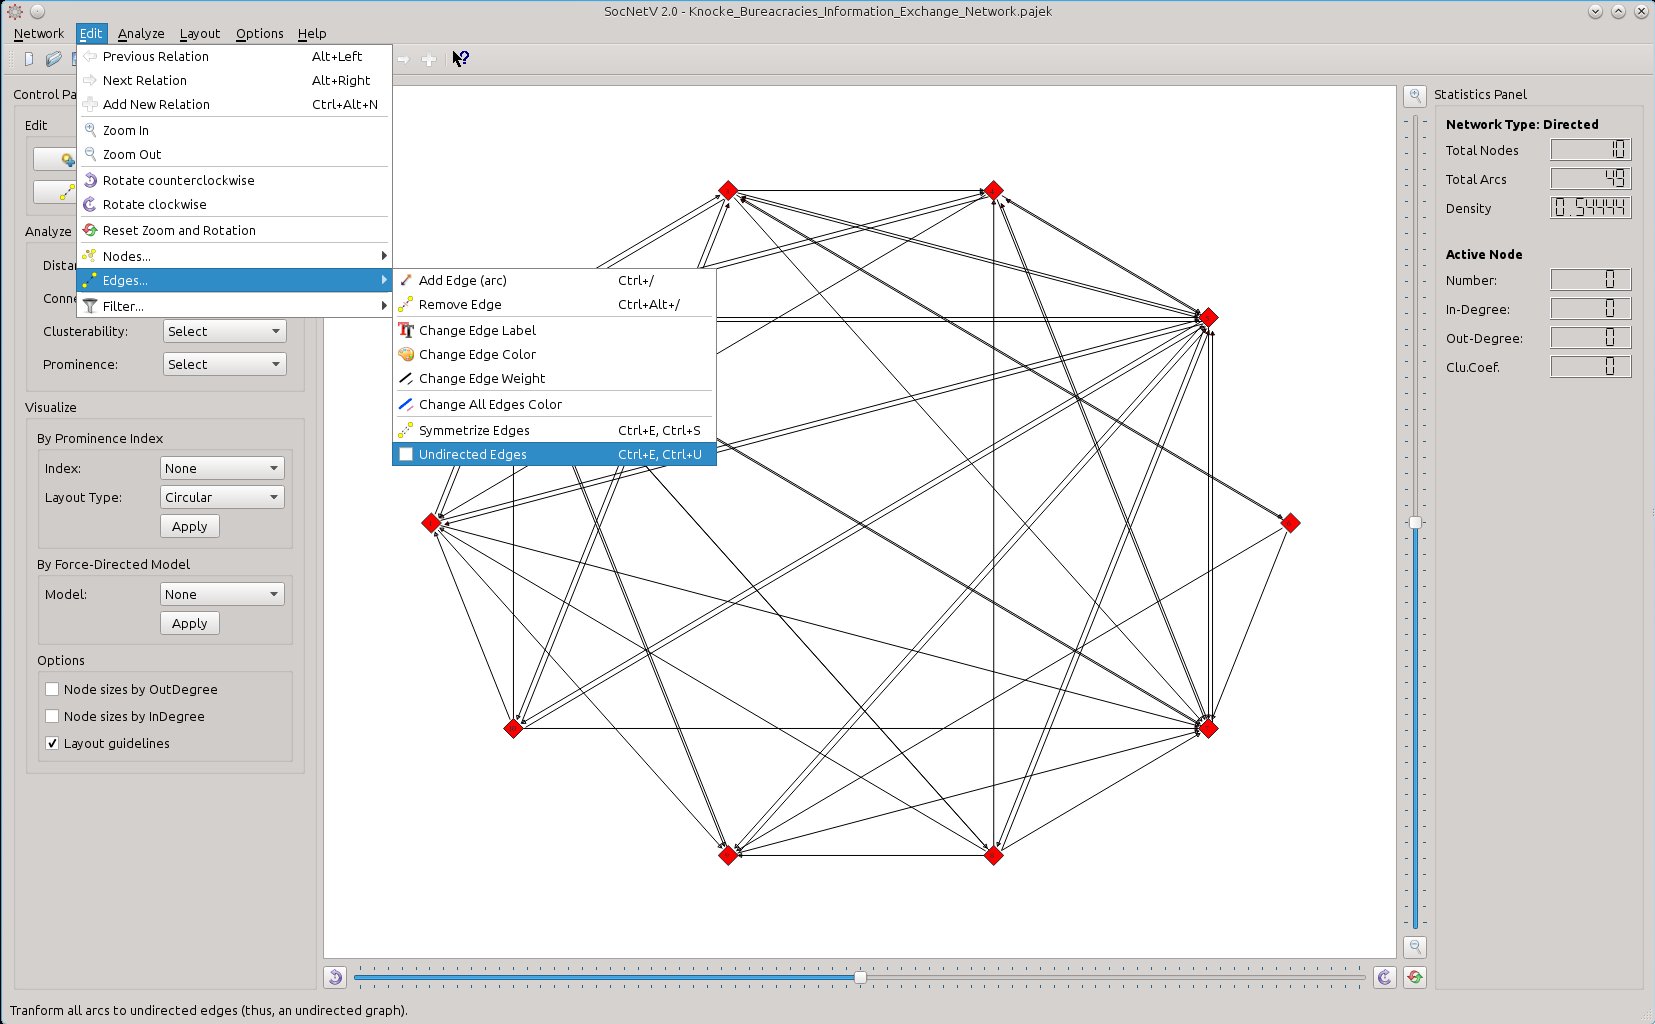
This option transforms all existing directed edges to undirected and enables the “undirected mode”. Any edge you add between nodes will be undirected.
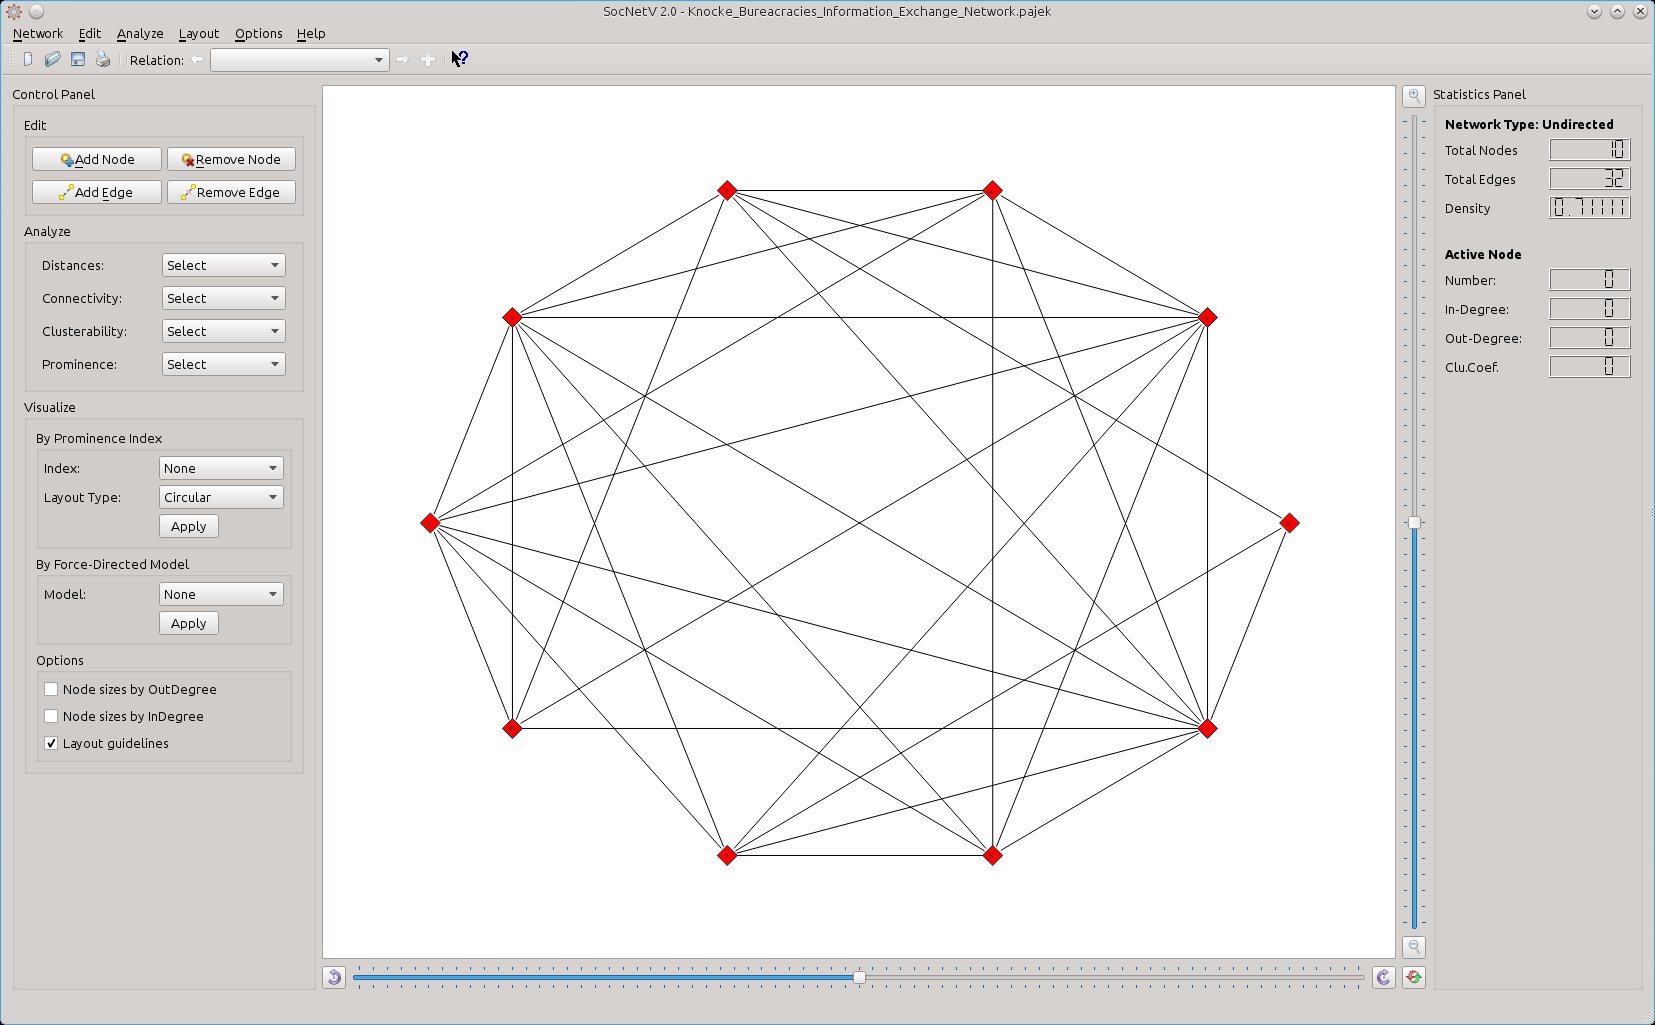
The same logic applies on loading social networks from a file. If the file explicitly declares undirected Edges or undirected Graph, the network is visualized with undirected edges, single lines with no arrows.
Note: At the moment this directed/undirected feature is supported mainly for GraphML and Pajek files.
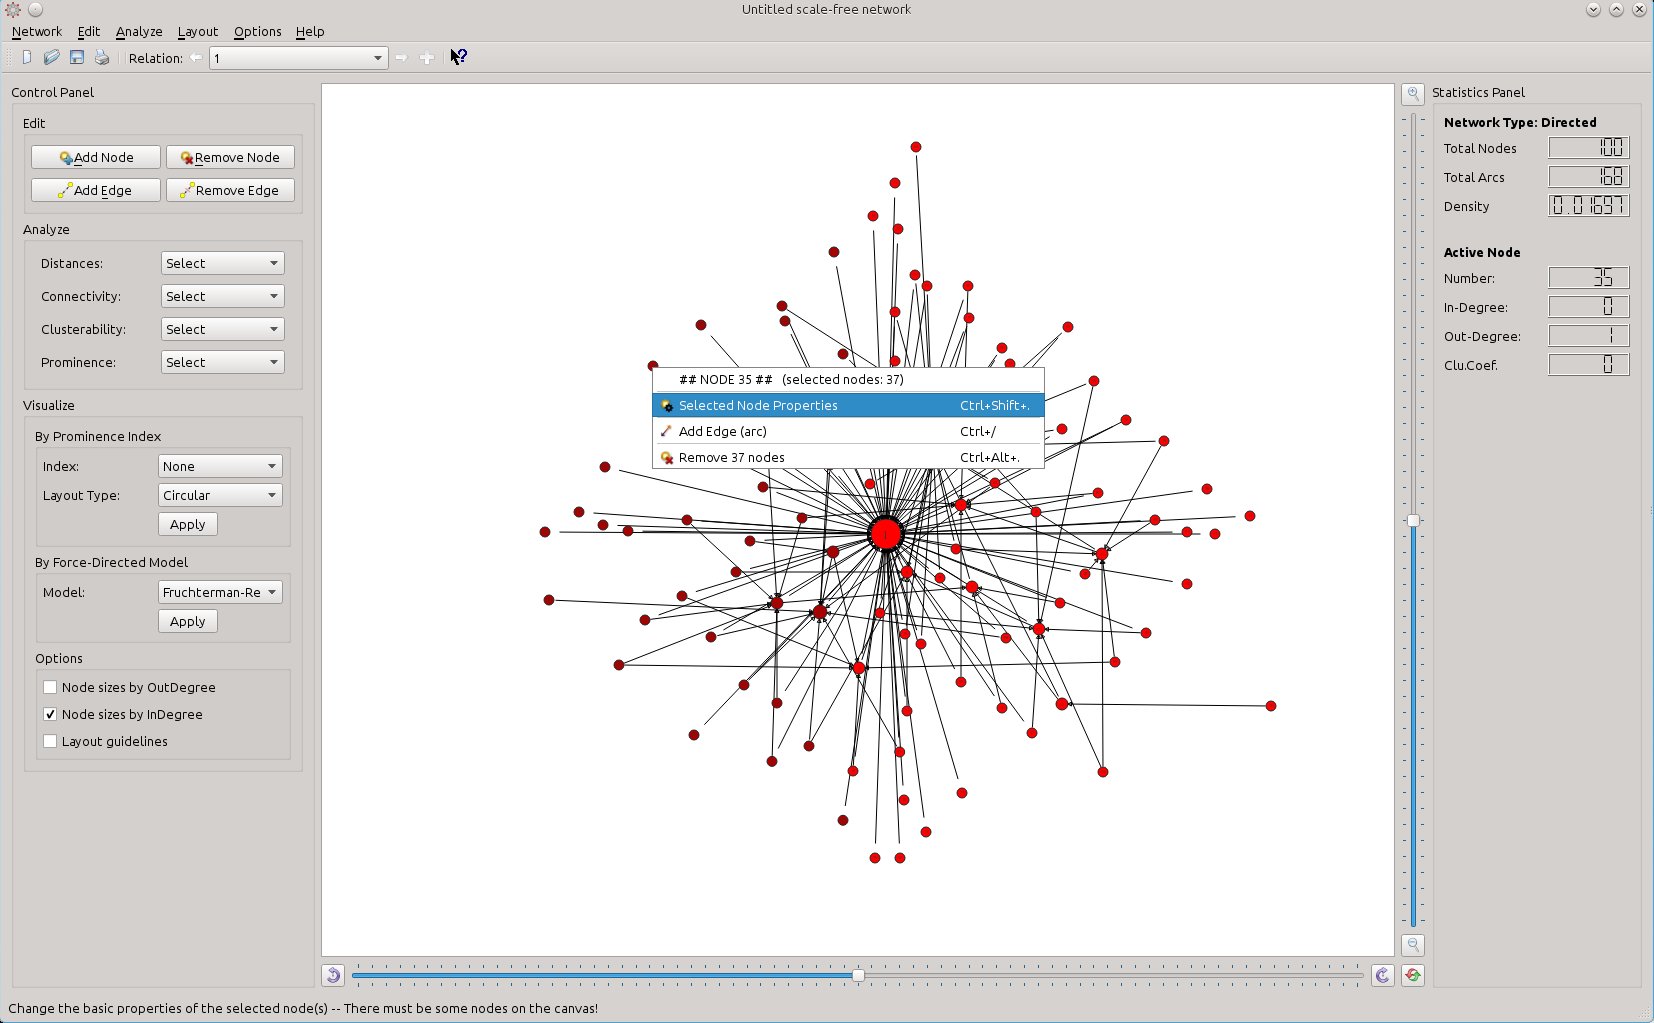
New feature: Delete multiple nodes at once.
Select any number of nodes (left-click on the canvas and drag to select all nodes in the rectangle rubber band). Then right-click on one of the selected nodes and select Remove nodes.
New feature: Node edges highlight.
When you hover on a node, the program highlight (in red) all edges of that node.
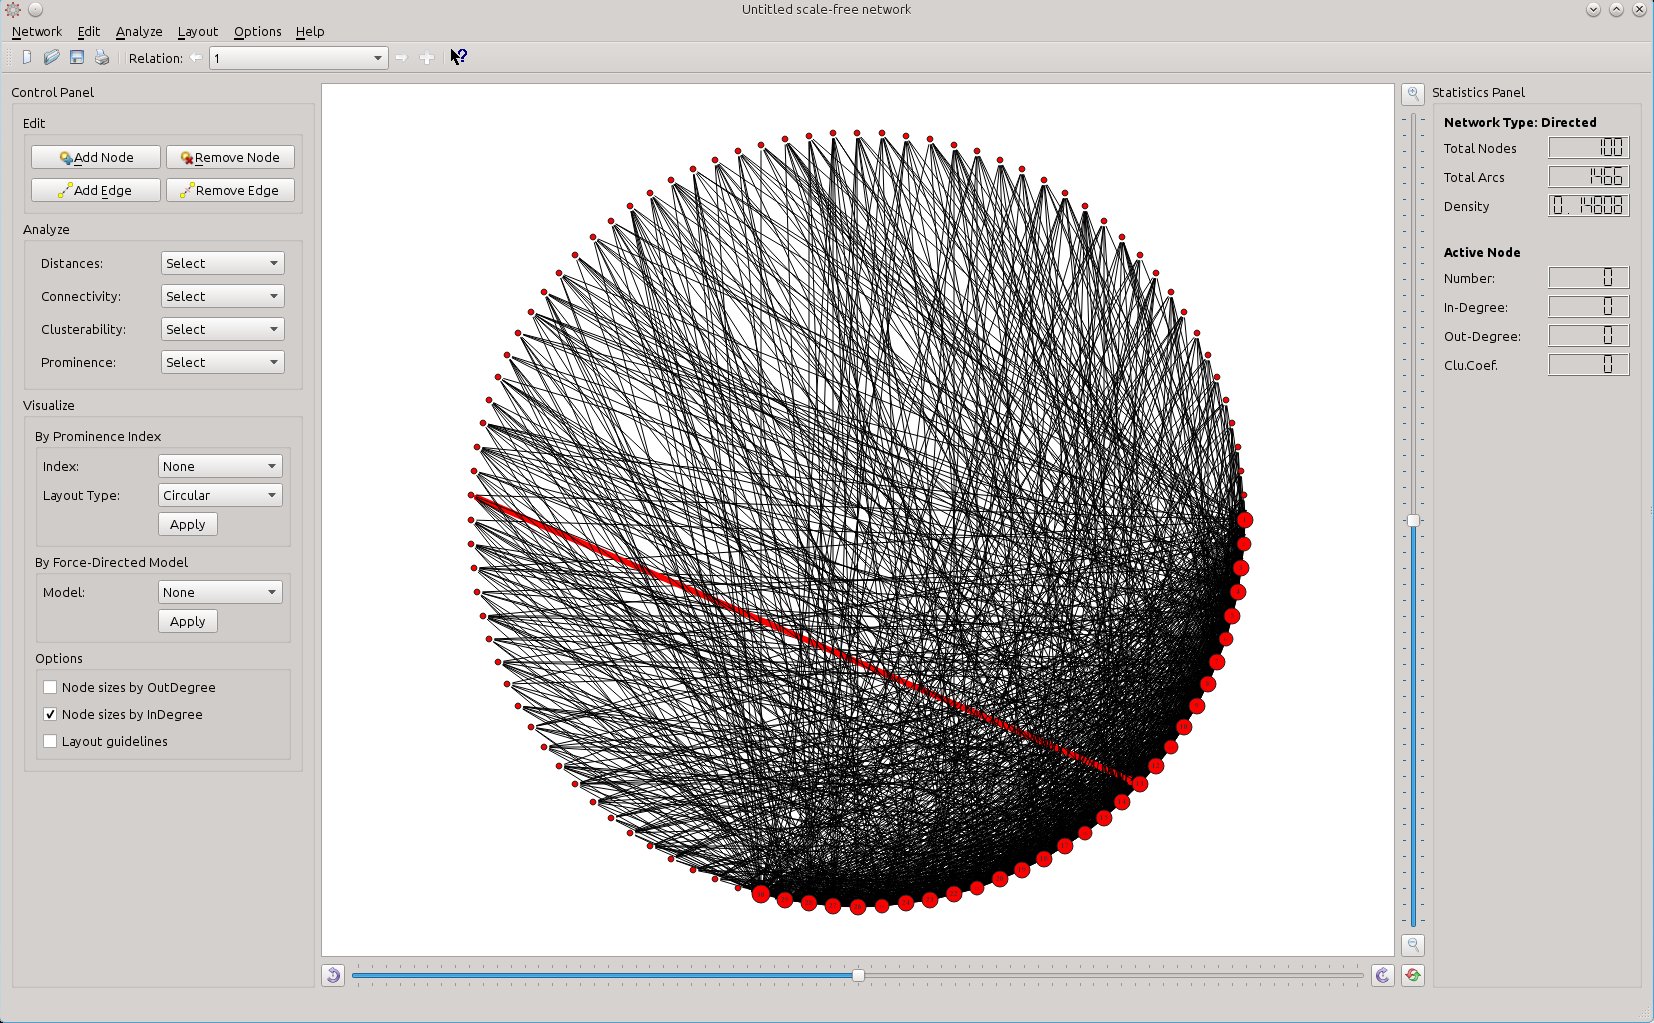
New feature: Edge highlight on hover.
Also, when you hover on an edge, that edge is highlighted (red color and increased width) to help you see at once the two nodes it connects.
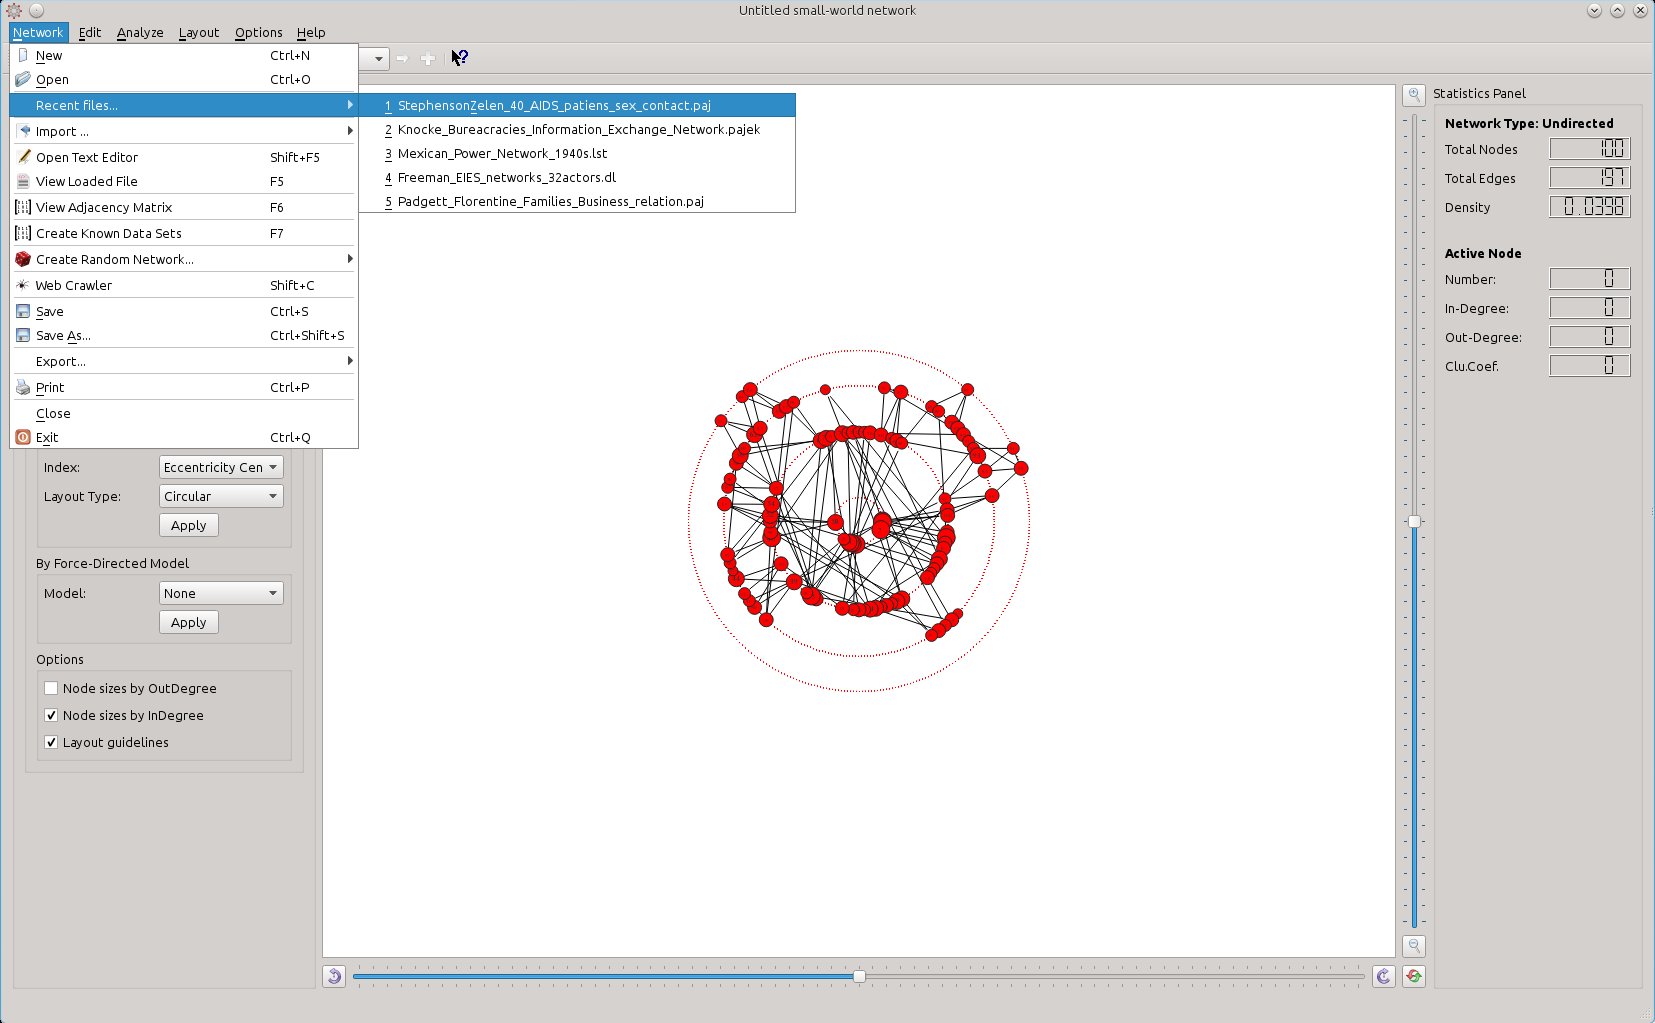
New feature: Recent files
Version 2.0 brings a nice Recent Files functionality, as submenu under the Network menu. Every time the user loads or saves a file, a relevant entry is added under Network → Recent Files. The application keeps a list of the last five saved or opened files along with their paths, so that the user can re-open them with one-click. Of course, Recent Files are preserved between sessions, so you can easily re-open your last saved social network analysis work.
Updated Manual with new looks!
The SocNetV Manual has been updated and it is now opened directly from the website instead of being local to your computer.
If you prefer to have the manual offline, its source files can be found in the archive tarball or zip file. To create the complete HTML manual, use the doxygen command.
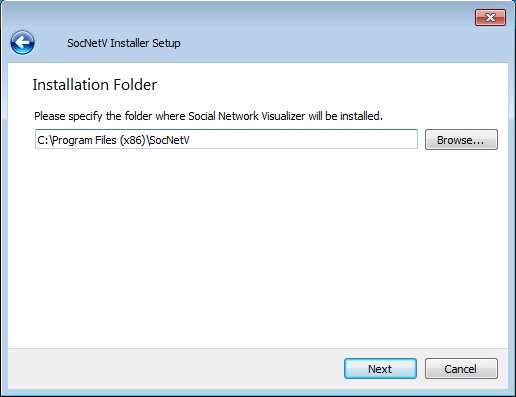
Windows 10 compatibility and user-friendly Installer!
SocNetV v2.0 Windows executable is compiled with the latest Qt version which supports Windows 10. Also the new version is now distributed with a nice and easy to use installer. Just download the installer, double-click on it to execute it and then press Continue a couple of times. The application will be properly installed and a shortcut will be added to your Start menu.